Atlas of MS FAQs

Welcome to the Atlas of MS help page.
I’m Rachel King and I manage the Atlas of MS project at the MS International Federation.
I’m here to help answer any questions you may have about the Atlas. Below you can find some frequently asked questions and answers. If your question is not answered below, please email me at [email protected]. I will get back to you, and also post the question and answer below (anonymously of course) to help other people.
The Atlas is a key tool for organisations, health professionals and individuals when advocating for improved surveillance data, and better access to treatment, care and support. It has also been widely cited in the research literature.
The main aims of the Atlas are to:
- highlight the global burden of MS and how this varies across the world
- stimulate additional systematic data gathering, particularly data on the epidemiology of MS
- highlight the barriers to accessing diagnosis, healthcare and treatments for MS and gaps in resources
- encourage use of the data to advocate for change globally and nationally
A few of the key findings from across the two reports from the 3rd Edition of the Atlas of MS are shown below – please see the full report for more detail:
- There are over 2.8 million people living with MS around the globe. This is the most accurate and up-to-date estimate of the number of people living with MS worldwide.
- The estimated number of people with MS globally has increased from 2.3 million people in 2013. Several factors are likely to have contributed to the increase, including: better counting methods nationally and globally as well as improved diagnosis, people with MS living longer and global population growth. However, from the data available we cannot rule out that there may also be some increase in the risk of developing MS.
- Every 5 minutes, someone, somewhere in the world is diagnosed with MS. (please note this is based on 81 reporting countries)
- The majority (83%) of countries worldwide have barriers that prevent early diagnosis of MS. Globally the most commonly reported barrier is a lack of awareness of MS symptoms amongst the public and healthcare professionals. An early diagnosis is vital to enable early treatment with disease modifying therapies that can minimise relapses and reduce future disability. Even if disease modifying therapies are not available, an early diagnosis is still crucial as it allows for lifestyle changes to help manage the disease and improve quality of life.
- 72% of countries cite barriers to accessing DMTs. Globally the most common barrier is the cost to the government, healthcare system or insurance provider, which is cited by experts in around half of all reporting countries.
- There is high unmet need for rehabilitation and symptom management, especially in lower middle and low income countries. Therapies for fatigue and cognitive impairment are not available in two-fifths of countries worldwide.
The estimate of over 2.8 million people with MS is higher than our estimate of 2.3 million people in 2013. Several factors are likely to contribute to the increase including better counting methods nationally and globally since then, as well as improved diagnosis, people with MS being diagnosed earlier and living longer, and population growth. However, from the data available we cannot rule out that there may also be some increase in the risk of developing MS.
Due to changes in our calculation method, we cannot directly compare the 2020–2022 figure to the global estimate from 2013. If we used the same methods, the global estimate would have increased by 30% in 7 years.
Experts from 125 countries completed the epidemiology survey in 2020-2022, representing 91% of the world’s population – an increase from 106 participating countries in 2013.
Prevalence data quantity and quality has improved. Experts in 114 countries reported prevalence data in 2020/2022 (representing 87% of the world population) compared with experts in 93 countries in 2013 (representing 79% of the global population).
Availability of high quality epidemiology varies considerably across the world and despite improvements in the number of countries reporting data to the Atlas, there are still big gaps in our evidence on MS across the globe.
A 95% confidence interval was calculated around our estimated prevalence of 35.91 (36) per 100,000 people and we can be 95% confident that the estimated world MS prevalence per 100,000 people is between 35.87 and 35.95 per 100,000 people.
Very few peer-reviewed publications exist on the availability of and access to MS diagnosis and treatment. To build a comprehensive picture we therefore relied on the expert opinion of clinicians or specialists with knowledge of that country. To improve confidence in the data collected, we asked country coordinators to collaborate with other experts and the vast majority did so.
However, we need to bear in mind that lack of up-to-date or complete surveillance data, the complexities of diagnosis and other inequalities and barriers in terms of accessing healthcare within nations are likely to mean our calculation is an underestimate.
If you want to reference the scientific publication (Walton et al, 2020), we suggest you use 2.8 million people (2.8M), as this is the number used in the publication.
MSIF will use ‘over 2.8M’ in our communications as we know that the 2.8M number has widespread recognition.
However, according to our latest data, the estimated global prevalence is now 2.9M and so if you want to use this number you can cite the Atlas website (www.atlasofms.org) with the date you accessed it.
The global demographic profiles are consistent with the 2013 Atlas.
- There are at least twice as many women with MS as there are men.
- 32 years is the average age of an MS diagnosis. As this is an age when people might be finding a long-term partner, having children, and forging careers, it’s important that support mechanisms are available to enable people to live the lives they want.
- MS doesn’t only affect adults – there are at least 27,000 people living with MS who are under 18. (Please note this is based on 49 reporting countries)
- 85% of people with MS are diagnosed with relapsing-remitting MS, and 12% with progressive MS. The remaining 3% are given an unknown disease type on diagnosis.
Although MS has been described and named as a neurological disease in adults for well over 100 years, it is only in the past few decades that it has been recognised that MS can occur in children too. More and more physicians consider this as a possible diagnosis when presented with symptoms consistent with central nervous system demyelination.
Knowledge about the incidence, diagnosis and clinical management of pediatric MS has expanded significantly in the past 10-15 years as research and dissemination of data has increased among the medical community. Around 30,000 children are reported to have MS from 55 countries.
In 2007, an International Pediatric MS Study Group was founded with the support of MSIF and several MS organisations. The group has published consensus statements about the diagnosis and clinical care of children with MS and the most promising avenues of future research. Research into possible genetic and environmental factors that may cause MS is an area of special interest in this field as it could yield valuable information about the development of MS in adults.
Most people with MS are initially diagnosed with relapsing-remitting MS (RRMS), where symptoms appear (relapse) over a short period of time, lasting between a few days and a few months. The symptoms then resolve (remission), sometimes for a long time. In progressive MS, there is a gradual accumulation of disability, with or without relapses.
A smaller percentage will develop progressive MS from the outset (primary progressive MS).
The reasons for the difference in risk between men and women are unknown but a variety of factors are likely to be influencing it such as hormonal and genetic differences, as well as differing social, lifestyle and environmental exposures between the sexes.
The Atlas of MS is a powerful tool to raise awareness and drive changes that improve quality of life for people affected by MS across the globe.
Given the vastly different contexts around the world, countries need to take an individual approach to turning the Atlas of MS data into evidence-based advocacy activity.
By working together to review the Atlas data for their countries, people affected by MS, their MS organisations, healthcare professionals and healthcare authorities can compare the situation in their country to other countries in their region or income band and to the global picture, and make plans to address the challenges they face.
Epidemiology recommendations
We call on governments, policy makers, healthcare professionals and the MS movement to make the most of this open-data resource by:
- Using and updating the statistics in the Atlas, to discover new insight, stimulate additional research, raise awareness of MS and support evidence-based advocacy efforts.
- Implementing systematic evidence collection in countries where there are gaps, particularly in low and lower middle income countries, to enable a more comprehensive understanding of the epidemiology of MS at the country, regional and global level.
- Prioritising the collection of incidence data to better understand the future trajectory of MS cases and plan healthcare resources for diagnosis and treatment accordingly.
- Recognising that some groups of the population are disproportionally affected by MS (females and young adults) and ensuring that this is accounted for as part of healthcare and support systems.
- Improving awareness that children and young people can develop MS. Enhance steps to collect data on pediatric cases as well as ensuring they have access to prompt diagnosis, the relevant treatments, specialist healthcare professionals as well as sufficient support for those affected and their families.
- Funding and implementing research projects to investigate how genetics, environments and other factors increase people’s chances of developing MS and identifying interventions that could prevent or delay onset.
Clinical management recommendations
- Each country should have a national plan or guidelines for the healthcare of people with MS.
- Such plans should aim to include: relevant standards; the most recent global diagnostic criteria for MS; guidance on the selection and management of different disease modifying therapies; and a pathway for accessing rehabilitation and symptomatic therapies.
- A range of DMTs should be available, to provide people with MS the most appropriate treatment for their disease and individual circumstances.
- In particular, countries should focus advocacy efforts on improving access to high efficacy DMTs, and ensuring continuity of treatment.
- Given the widespread use of off-label DMTs, evidence-based guidance on the use of off-label DMTs should be made available to support clinical decision-making and reimbursement decisions.
- Affordability of DMTs needs to be improved.
- There are already drug access schemes that allow people with MS to be treated with DMTs at reduced cost in many countries. Despite this, DMTs for MS are still too costly in many settings. The cost of DMTs should be addressed to create fair and sustainable solutions for the payers (such as governments, healthcare systems and insurance providers) as well as for the pharmaceutical industry, and others involved in the chain of healthcare provision.
- Focus should also be placed on ensuring costs for people with MS are affordable and in line with local income levels.
- Organisations/networks that focus on neurological conditions should work together to enable earlier diagnosis, effective treatment and support for neurological conditions, including MS.
- In particular, they should collaborate on shared challenges such as:
- The number and training of neurologists, and other professionals involved in neurological care
- Access to cost-effective diagnostic tests, equipment and medicines
This will help shape the forthcoming WHO global action plan on epilepsy and other neurological disorders
- In particular, they should collaborate on shared challenges such as:
- Healthcare authorities, research institutions, MS organisations, and healthcare professionals should collaborate in the collection of data relating to MS, needed to establish and monitor standards for MS healthcare.
- MS data collection will need to improve in most countries to understand and track progress against national and international standards. Healthcare authorities, research institutions, MS organisations, and healthcare professionals should work together to develop, communicate and implement minimum data requirements for MS surveillance.
The information in the Atlas of MS can be a powerful advocacy tool, shining a spotlight on MS and raising awareness of the barriers to accessing diagnosis and care for people with MS worldwide. In 2008 the Atlas found that Ireland, with only 14 neurologists, had the lowest number of neurologists per 100,000 people in Europe. It was one of the tools that MS Ireland and the Neurological Alliance of Ireland used to persuade the government to make a commitment to ensure that there is one neurologist per 100,000 people.
Since then there has been a steady increase in numbers rising to 26 (0.6 per 100,000) in 2013 and in 2020 there were 37 (0.8 per 100,000). Despite this positive trend, the numbers of this vital workforce still lag behind Ireland’s target and indeed the levels seen in all other European countries.
If you have an example of an improvement that the Atlas of MS has helped bring about, please email to let me know [email protected].
The Atlas of MS is a powerful advocacy tool. We have illustrated a few ways you can use the data and social media tools we have provided to raise awareness, get noticed or to support advocacy or our advocacy pages.
We are very interested in hearing other suggestions for how the Atlas data (or similar data you have collected in your country) could be used in advocacy work so if you have any other ideas of how the data can be used in this way, please email to let me know [email protected].
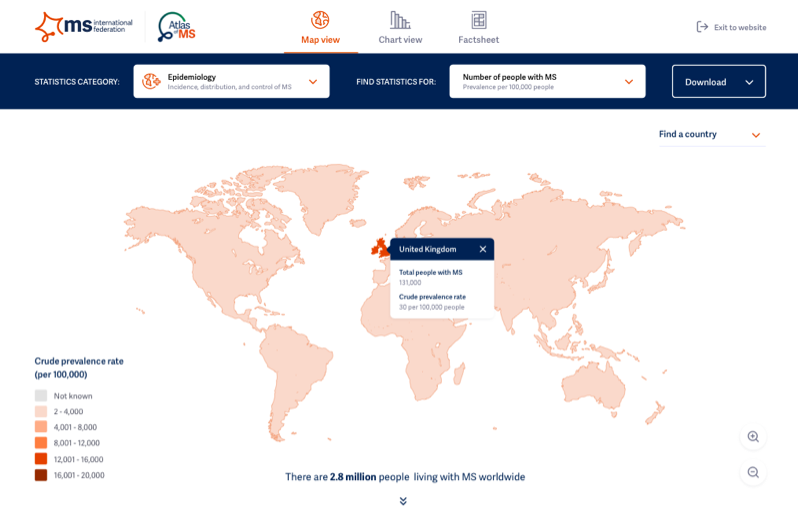
The Atlas data tool allows you to see how MS varies across the world on maps and charts. On the map view you can hoover your mouse over a country and a pop-up box will show the relevant data for that country. On the chart view, you can compare your country of interest vs the whole globe, and by the World Health Organization (WHO) regions and World Bank Income categories. Additionally you can download key statistics for a country of interest via the country factsheet, which is available in English Spanish or Arabic.
![]()
Some statistics are shown in all 3 formats (map, chart, factsheet), others are only shown in one. You can choose the format you wish to view by selecting one of the 3 types of views (as indicated in the visual above) and you can find this at the top of the screen above the analytical tool. You can scroll down below the map/chart and factsheet to download the full report and view other content.

To choose the statistic you are interested in please click on the statistics category (at the moment though there is only data for Epidemiology, and country classification – Clinical Management will be released early 2021) and then you can choose the statistic you are interested in from the drop-down menu at: Find statistics for

The maps show the data for all countries around the world and you can use the zoom +/- buttons at the bottom of the screen to magnify the map. If you are unsure of how to find a country you can also select this via the drop-down menu “Find a country” on the right hand side, below the blue band. Hoovering over a country will bring up a popup box which will show the relevant data.

You can download the map by pressing the download button.

On the chart view, you can change the country of interest by using the drop-down menu and it will show you all relevant countries
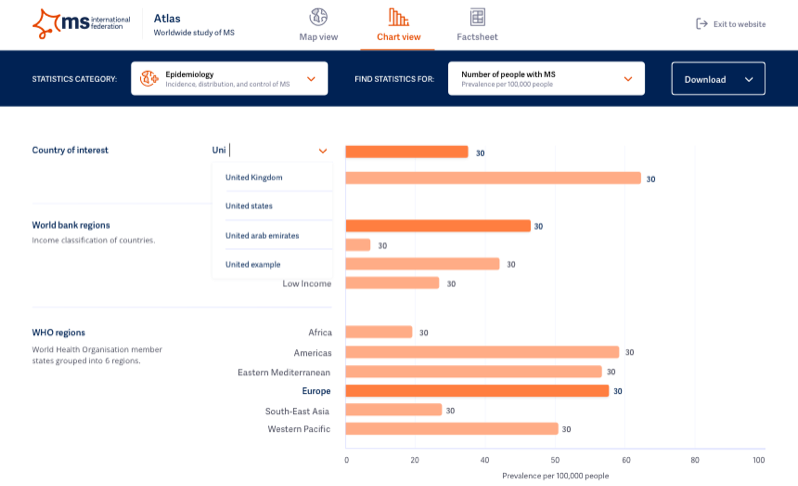
On the chart view you can see your country of interest, and compare this with the global total, the World Bank Income categories and the World Health Organization regions. The regions/categories that the country of interest falls into are shown in a darker orange (and with bolder text) so you can see if the country of interest is higher or lower compared to the average for the region/income category.
The chart can also be downloaded.
To compare multiple countries you can download multiple charts or factsheets or you have the option of downloading the full data set to conduct your own analysis.
The data is open-source so you are welcome to use it, but please use the following citation:
Multiple Sclerosis International Federation – Atlas of MS – 3rd Edition (and the date you downloaded or accessed the data from the website)
Our plan is to update the core Atlas epidemiology data on an annual basis to allow new countries to be included and exisiting country data to be updated using new evidence.
If your country is not included in the Atlas of MS, please get in touch by emailing me at [email protected] and we would be happy to include the data in our next update.
Please let us know if there has been a new epidemiology study in your country by emailing me at [email protected]. I will then get in touch to find out more about the study and the new data. We will need to verify and validate this data (which will include corresponding with the original country coordinator) prior to inputting it into our database.
Any new information you provide not only affects the data for your country, it also feeds into the global, regional and income aggregate totals that we report.
We have provided some social media tools in English, Arabic and Spanish for you to use in your own country. You are welcome to translate these into your own language but if you do please could you share these with us by emailing [email protected].
You can create your own key messages based on the information available in the Atlas. Consider the needs and experience of people affected by MS in your country, and tailor the messages to your advocacy priorities. To access the social media tools and other assets please Click here.
You can find the key data from both the 2013 and 2008 Atlas in the full dataset. The 2013 report can be found here: http://www.msif.org/wp-content/uploads/2014/09/Atlas-of-MS.pdf and the 2008 here: https://www.who.int/mental_health/neurology/Atlas_MS_WEB.pdf

You can see a visual representation of how the countries are grouped into the World Health Organization regions or World Bank Income Group (June 2020) in the map view of the analytical tool and by clicking on the drop-down menu to country classification and then selecting the appropriate map from the ’find the statistics’ drop-down. If you hoover over the country of interest with your cursor you will see the details in a pop-up box
Country |
WHO Region |
World Income Bank Level
|
|---|---|---|
| Afghanistan | Eastern Mediterranean | Low income |
| Albania | European | Upper middle income |
| Algeria | African | Lower middle income |
| American Samoa | Western Pacific | Upper middle income |
| Andorra | European | High income |
| Angola | African | Lower middle income |
| Antigua and Barbuda | Americas | High income |
| Argentina | Americas | Upper middle income |
| Armenia | European | Upper middle income |
| Aruba | Americas | High income |
| Australia | Western Pacific | High income |
| Austria | European | High income |
| Azerbaijan | European | Upper middle income |
| Bahamas, The | Americas | High income |
| Bahrain | Eastern Mediterranean | High income |
| Bangladesh | South-East Asia | Lower middle income |
| Barbados | Americas | High income |
| Belarus | European | Upper middle income |
| Belgium | European | High income |
| Belize | Americas | Upper middle income |
| Benin | African | Lower middle income |
| Bermuda | Americas | High income |
| Bhutan | South-East Asia | Lower middle income |
| Bolivia | Americas | Lower middle income |
| Bosnia and Herzegovina | European | Upper middle income |
| Botswana | African | Upper middle income |
| Brazil | Americas | Upper middle income |
| British Virgin Islands | Americas | High income |
| Brunei Darussalam | Western Pacific | High income |
| Bulgaria | European | Upper middle income |
| Burkina Faso | African | Low income |
| Burundi | African | Low income |
| Cabo Verde | African | Lower middle income |
| Cambodia | Western Pacific | Lower middle income |
| Cameroon | African | Lower middle income |
| Canada | Americas | High income |
| Cayman Islands | Americas | High income |
| Central African Republic | African | Low income |
| Chad | African | Low income |
| Channel Islands | European | High income |
| Chile | Americas | High income |
| China | Western Pacific | Upper middle income |
| Colombia | Americas | Upper middle income |
| Comoros | African | Lower middle income |
| Congo, Democratic Republic of | African | Low income |
| Congo, republic of | African | Lower middle income |
| Cook Islands | Western Pacific | Unknown |
| Costa Rica | Americas | Upper middle income |
| Cote d’lvoire | African | Lower middle income |
| Croatia | European | High income |
| Cuba | Americas | Upper middle income |
| Curaçao | Americas | High income |
| Cyprus | European | High income |
| Czech Republic | European | High income |
| Denmark | European | High income |
| Djibouti | Eastern Mediterranean | Lower middle income |
| Dominica | Americas | Upper middle income |
| Dominican Republic | Americas | Upper middle income |
| Ecuador | Americas | Upper middle income |
| Egypt | Eastern Mediterranean | Lower middle income |
| El Salvador | Americas | Lower middle income |
| Equatorial Guinea | African | Upper middle income |
| Eritrea | African | Low income |
| Estonia | European | High income |
| Eswatini | African | Lower middle income |
| Ethiopia | African | Low income |
| Fiji | Western Pacific | Upper middle income |
| Finland | European | High income |
| France | European | High income |
| French Polynesia | Western Pacific | High income |
| Gabon | African | Upper middle income |
| Gambia,The | African | Low income |
| Georgia | European | Upper middle income |
| Germany | European | High income |
| Ghana | African | Lower middle income |
| Gibraltar | European | High income |
| Greece | European | High income |
| Greenland | European | High income |
| Grenada | Americas | Upper middle income |
| Guam | Western Pacific | High income |
| Guatemala | Americas | Upper middle income |
| Guinea | African | Low income |
| Guinea-Bissau | African | Low income |
| Guyana | Americas | Upper middle income |
| Haiti | Americas | Lower middle income |
| Honduras | Americas | Lower middle income |
| Hong Kong | Western Pacific | High income |
| Hungary | European | High income |
| Iceland | European | High income |
| India | South-East Asia | Lower middle income |
| Indonesia | South-East Asia | Lower middle income |
| Iran, Islamic Republic of | Eastern Mediterranean | Lower middle income |
| Iraq | Eastern Mediterranean | Upper middle income |
| Ireland | European | High income |
| Isle of Man | European | High income |
| Israel | European | High income |
| Italy | European | High income |
| Jamaica | Americas | Upper middle income |
| Japan | Western Pacific | High income |
| Jordan | Eastern Mediterranean | Upper middle income |
| Kazakhstan | European | Upper middle income |
| Kenya | African | Lower middle income |
| Kiribati | Western Pacific | Lower middle income |
| Korea, Democratic People’s Republic of | South-East Asia | Low income |
| Korea, Republic of | Western Pacific | High income |
| Kosovo | European | Upper middle income |
| Kuwait | Eastern Mediterranean | High income |
| Kyrgyzstan | European | Lower middle income |
| Lao, People’s Democratic Republic of | Western Pacific | Lower middle income |
| Latvia | European | High income |
| Lebanon | Eastern Mediterranean | Lower middle income |
| Lesotho | African | Lower middle income |
| Liberia | African | Low income |
| Libya | Eastern Mediterranean | Upper middle income |
| Liechtenstein | European | High income |
| Lithuania | European | High income |
| Luxembourg | European | High income |
| Macao SAR | South-East Asia | High income |
| Madagascar | African | Low income |
| Malawi | African | Low income |
| Malaysia | Western Pacific | Upper middle income |
| Maldives | South-East Asia | Upper middle income |
| Mali | African | Low income |
| Malta | European | High income |
| Marshall Islands | Western Pacific | Upper middle income |
| Mauritania | African | Lower middle income |
| Mauritius | African | Upper middle income |
| Mexico | Americas | Upper middle income |
| Micronesia, Federated States of | Western Pacific | Lower middle income |
| Moldova, Republic of | European | Upper middle income |
| Monaco | European | High income |
| Mongolia | Western Pacific | Lower middle income |
| Montenegro | European | Upper middle income |
| Morocco | Eastern Mediterranean | Lower middle income |
| Mozambique | African | Low income |
| Myanmar | South-East Asia | Lower middle income |
| Namibia | African | Upper middle income |
| Nauru | Western Pacific | High income |
| Nepal | South-East Asia | Lower middle income |
| Netherlands | European | High income |
| New Caledonia | Western Pacific | High income |
| New Zealand | Western Pacific | High income |
| Nicaragua | Americas | Lower middle income |
| Niger | African | Low income |
| Nigeria | African | Lower middle income |
| Niue | Western Pacific | Unknown |
| North Macedonia | European | Upper middle income |
| Northern Mariana Islands | Western Pacific | High income |
| Norway | European | High income |
| Oman | Eastern Mediterranean | High income |
| Pakistan | Eastern Mediterranean | Lower middle income |
| Palau | Western Pacific | Upper middle income |
| Palestinian Authority | Eastern Mediterranean | Lower middle income |
| Panama | Americas | High income |
| Papua New Guinea | Western Pacific | Lower middle income |
| Paraguay | Americas | Upper middle income |
| Peru | Americas | Upper middle income |
| Philippines | Western Pacific | Lower middle income |
| Poland | European | High income |
| Portugal | European | High income |
| Puerto Rico | Americas | High income |
| Qatar | Eastern Mediterranean | High income |
| Romania | European | High income |
| Russian Federation | European | Upper middle income |
| Rwanda | African | Low income |
| Saint Kitts and Nevis | Americas | High income |
| Saint Lucia | Americas | Upper middle income |
| Saint Vincent and the Grenadines | Americas | Upper middle income |
| Samoa | Western Pacific | Lower middle income |
| San Marino | European | High income |
| Sao Tome and Principe | African | Lower middle income |
| Saudi Arabia | Eastern Mediterranean | High income |
| Senegal | African | Lower middle income |
| Serbia | European | Upper middle income |
| Seychelles | African | High income |
| Sierra Leone | African | Low income |
| Singapore | Western Pacific | High income |
| Sint Maarten (Dutch part) | Americas | High income |
| Slovakia | European | High income |
| Slovenia | European | High income |
| Solomon Islands | Western Pacific | Lower middle income |
| Somalia | Eastern Mediterranean | Low income |
| South Africa | African | Upper middle income |
| South Sudan | African | Low income |
| Spain | European | High income |
| Sri Lanka | South-East Asia | Lower middle income |
| St Martin (French part) | Americas | High income |
| Sudan | Eastern Mediterranean | Low income |
| Suriname | Americas | Upper middle income |
| Sweden | European | High income |
| Switzerland | European | High income |
| Syrian Arab Republic | Eastern Mediterranean | Low income |
| Taiwan | Western Pacific | High income |
| Tajikistan | European | Lower middle income |
| Tanzania, United Republic of | African | Lower middle income |
| Thailand | South-East Asia | Upper middle income |
| Timor-Leste | South-East Asia | Lower middle income |
| Togo | African | Low income |
| Tonga | Western Pacific | Upper middle income |
| Trinidad and Tobago | Americas | High income |
| Tunisia | Eastern Mediterranean | Lower middle income |
| Turkey | European | Upper middle income |
| Turkmenistan | European | Upper middle income |
| Turks and Caicos Islands | Americas | High income |
| Tuvalu | Western Pacific | Upper middle income |
| Uganda | African | Low income |
| Ukraine | European | Lower middle income |
| United Arab Emirates | Eastern Mediterranean | High income |
| United Kingdom | European | High income |
| United States of America | Americas | High income |
| Uruguay | Americas | High income |
| Uzbekistan | European | Lower middle income |
| Vanuatu | Western Pacific | Lower middle income |
| Venezuela | Americas | Unknown |
| Vietnam | Western Pacific | Lower middle income |
| Virgin Islands | Americas | High income |
| Yemen | Eastern Mediterranean | Low income |
| Zambia | African | Low income |
| Zimbabwe | African | Lower middle income |
Core data updates:
Since we published the 3rd edition data in 2020/2021 (part 1 Epidemiology and Part 2 Clinical Management) – we continue to update core data on epidemiology and DMT usage at regular intervals to ensure it remains current.
Topical surveys:
- Already published:
- 2022 – Disease Modifying Therapies (DMTs) usage and Expanded Disability Status Score (EDSS) – data already available on the Atlas website. Click for survey questions.
- Coming soon!:
- Data on diagnostic tests/procedures available and used for MS, barriers to using these tests/procedures regularly for MS diagnosis, impact of the visual system as a region of dissemination in space on the diagnosis of MS, time to MRI results, length of diagnosis appointment, topics included in guidelines for MS diagnosis/care and how neurologists prefer to hear about updates to diagnostic, treatment and management guidelines. Click for survey questions. Data collected in 2024 and will be available in 2025. This data will help us understand preparedness to implement the updated MS diagnostic criteria and how best to communicate these changes to clinicians.